DATA FOUNDATION
Exports validated, cost and billing rates checked, balances tied out.
A financial operating system built only for A/E firms. It shows you what's coming, and what to do about it, before it reaches the P&L.
Architecture and engineering is all we do. The metrics are yours, not generic small-business KPIs.
Weekly, monthly, rolling, and annual reporting that runs on a set rhythm, every month.
Runs on exports from the accounting and project systems you already use. Nothing to replace.
TA report tells you what happened last month. By the time it arrives, the hours are four weeks old, the write-downs are already booked and the gap in your backlog is already closer. An operating system works the other way. It watches the numbers that move first, on a schedule, and turns each finding into a decision for the partners.
LFOS is that system. It combines a fixed reporting cadence, a short list of A/E-specific metrics and a CFO who reads them with you and tells you what to do next.
PRODUCTIVITY FLASH
Billable hours, total hours, utilization and realization for every person, before the month closes. It's preliminary by design, so you see capacity and write-down patterns while there's still time to act.
CLOSE PACKAGE
A KPI scorecard, the P&L with revenue tied to what was actually billed, and a written CFO narrative that ends with the decisions the partners need to make this month.
FORECASTS
A 15-month revenue forecast that shows the month where signed work runs out, and a 13-week cash view that maps invoices to the week you expect the money.
BILLING RATE FLOOR
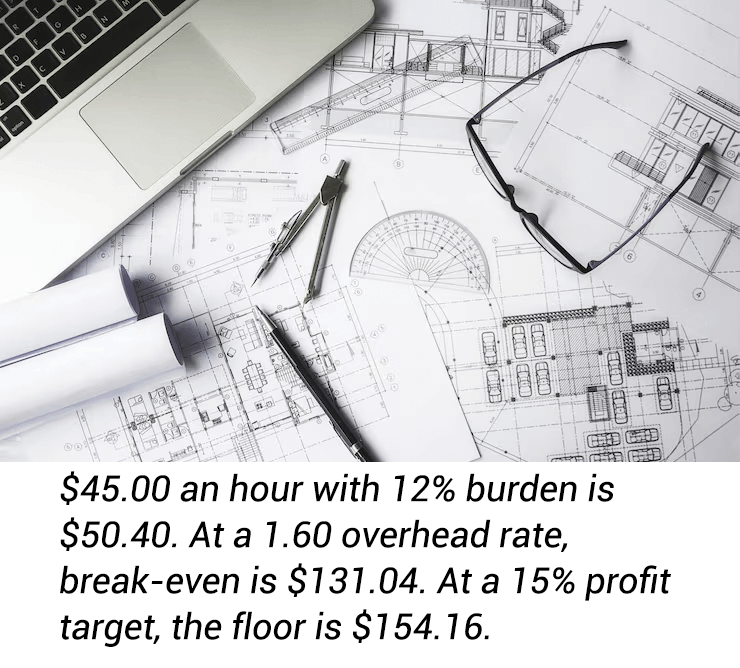
For every billable person, the lowest rate that covers their pay, payroll taxes, share of overhead and your profit target, rebuilt from payroll each planning season.
What a closed project says about pricing and scope on the next one.
Why profit moved, ranked in dollars: pricing, write-downs, utilization or overhead.
A structured plan when cash, realization or debt costs move the wrong way.
| METRIC | HOW IT'S CALCULATED |
|---|---|
| NET MULTIPLIER | net revenue ÷ direct labor How much revenue each dollar of billable labor produces. |
| OVERHEAD RATE | indirect costs ÷ direct labor What it costs to support each dollar of billable labor. Excludes interest and income taxes. |
| BREAK-EVEN RATE | 1 + overhead rate The multiplier needed just to cover cost. |
| UTILIZATION | billable hours ÷ total hours How much of your team's time is going to client work. |
| REALIZATION | net revenue ÷ standard billable value How much of the time billed at standard rates you actually collect. |
| DIRECT LABOR / NET REVENUE | direct labor ÷ net revenue What share of revenue your billable labor consumes. |
| EFFECTIVE BILLING RATE | net revenue ÷ billable hours What an hour of work really brings in, after write-downs. |
A. Hourly Cost = wages ÷ hours paid
B. Burdened Cost = hourly cost × (1 + payroll taxes and match %)
C. Break-Even = burdened cost × (1 + overhead rate)
D. Floor = break-even ÷ (1 − profit target)
Weeks 1–2
Exports validated, cost and billing rates checked, balances tied out.
Week 2
Your KPI baseline and your first monthly close package.
Weeks 3–4
Your 15-month revenue forecast and 13-week cash view.
Day 45
A written CFO assessment and a readout call with the partners.
Firms that continue move to a monthly engagement, scaled to firm size and complexity. The full cadence runs every week and month, with a standing CFO meeting and the annual rate floor each planning season.
Standard exports from your accounting and project systems, one point of contact for questions, and two calls: a kickoff and the day-45 readout. The rest is our work.
Thirty minutes, no preparation needed. We'll look at where your numbers stand and whether a sprint makes sense for your firm.